Customising dashboards
Your Dashboard is made up of a variety of data widgets which can be customised to suit your needs. Change the view of your Dashboards page by selecting which data fields are visible and organising the page layout, making it easier to see the data which matters most.
Last updated 3 days ago
Editing dashboards
To access your Dashboard, click Analytics (squares icon) from the left menu
Then click Dashboard from the options
Once you’re in your Dashboard page, select the Customise button in the top-right of the page
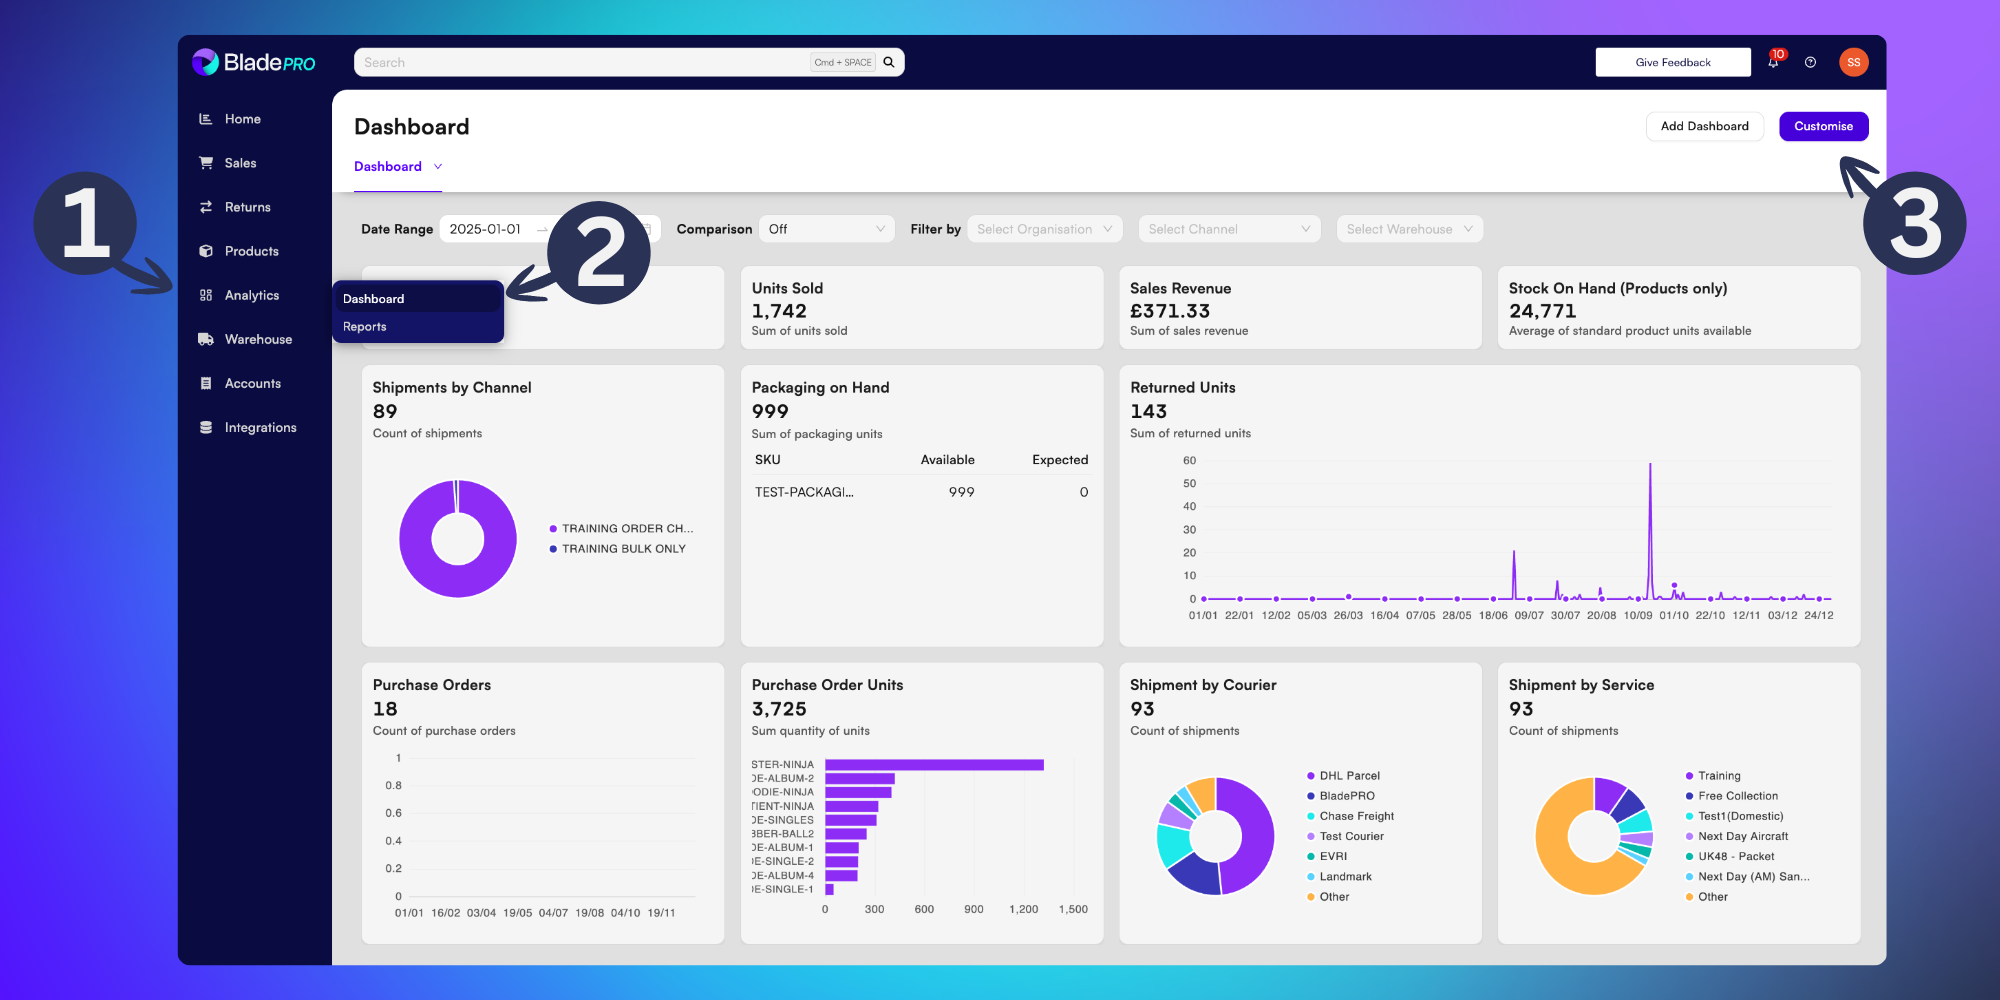
This puts you in edit mode. To confirm any changes to your dashboard you will need to select the Save button. If you don’t wish to save your changes you can exit the editor by clicking Cancel.
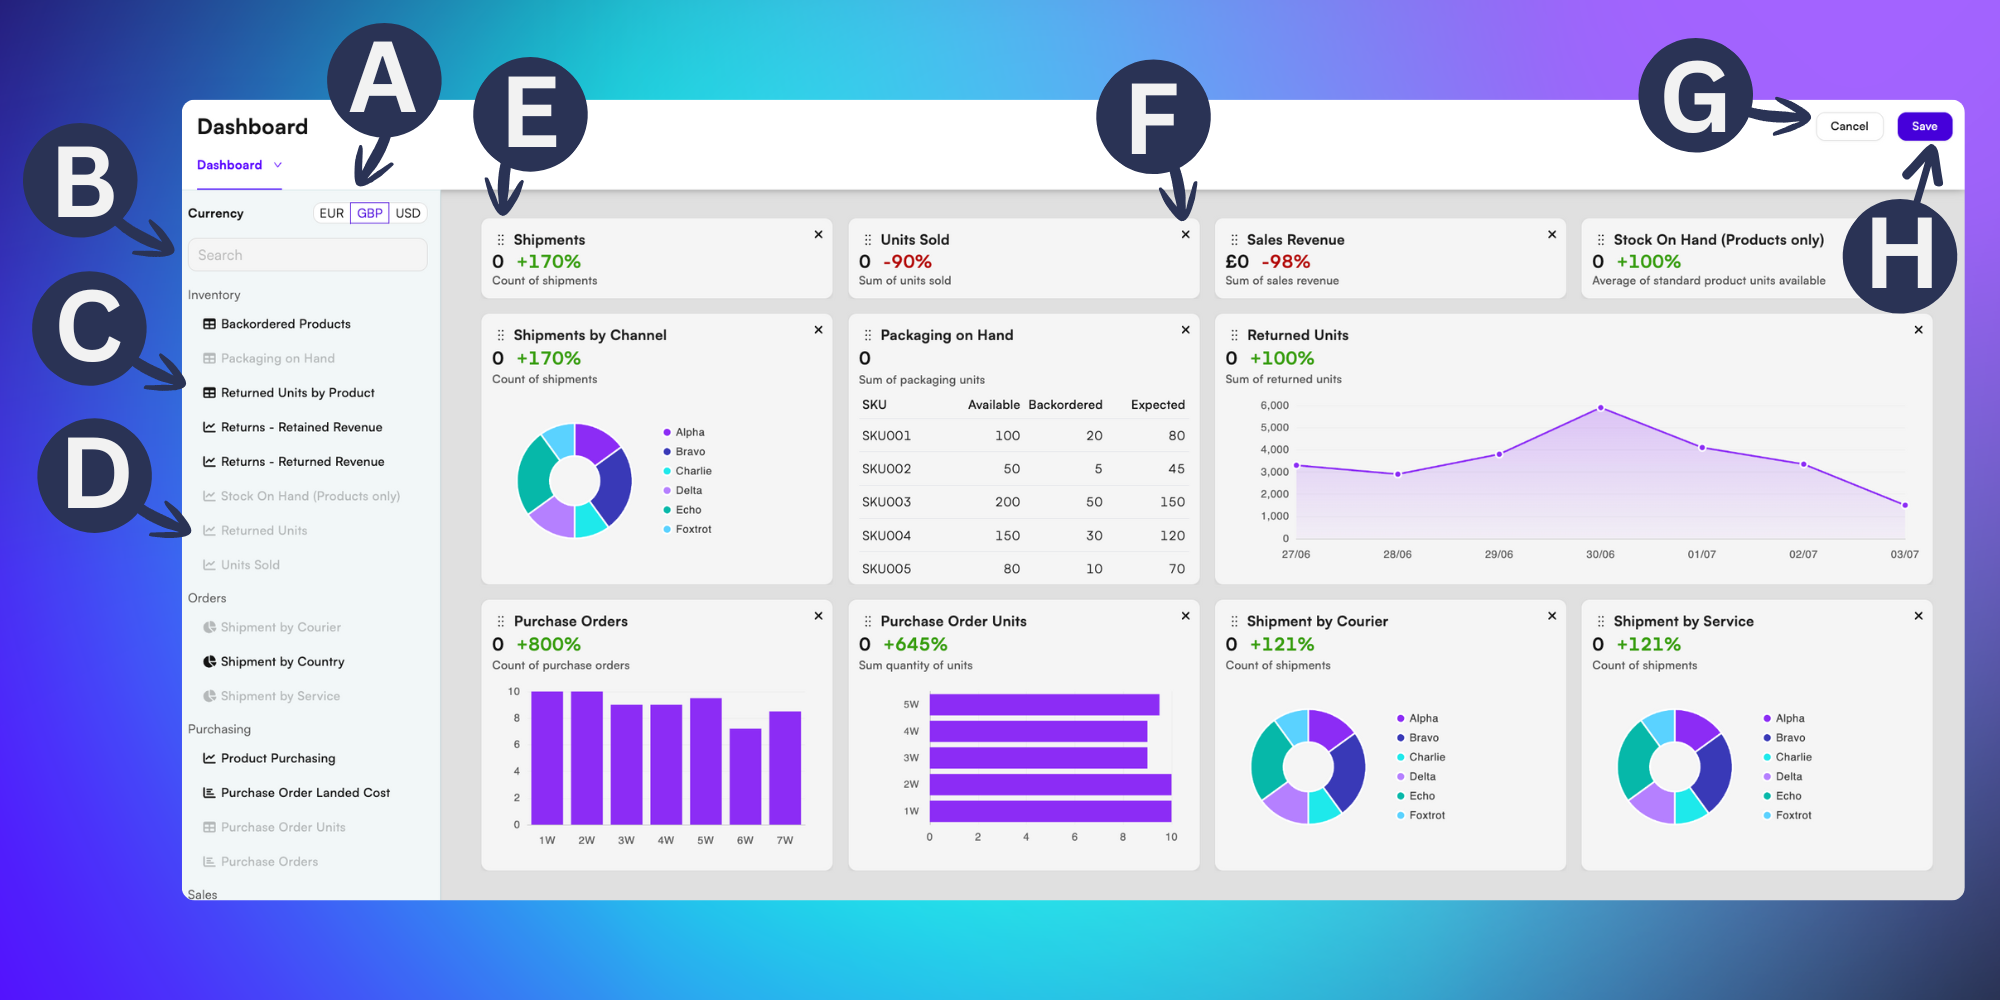
The types of changes which can be made include:
A) Currency toggle - Choose which currency you’d like to view data in from a choice of Euros, Great British Pounds and Unites States Dollars.
B) Search bar - Speed up your customisation by searching for charts and data fields to add to your dashboard.
C) Data fields not in use - The darker font colour indicates a chart or data field that isn’t yet featured in the dashboard. Select it to add it to your dashboard.
D) Active data fields - This indicates a data field that is already present in your dashboard.
E) Move data widget - Click and drag the 6 dots icon to move the widget to a different location on the dashboard.
F) Remove data widget from dashboard - Click the X icon to remove this data field from your dashboard. It will be available in the left menu to be added again if required.
G) Cancel - Click here to exit without saving your changes.
F) Save - Click here to confirm any changes and update your live dashboard.