Exploring Reports
The Reports area in BladePRO provides access to flexible datasets across a range of records that help you analyse performance trends and provide an interface to export data for deeper analysis. Here's everything you need to know about Reports.
Last updated 4 months ago
Finding reports
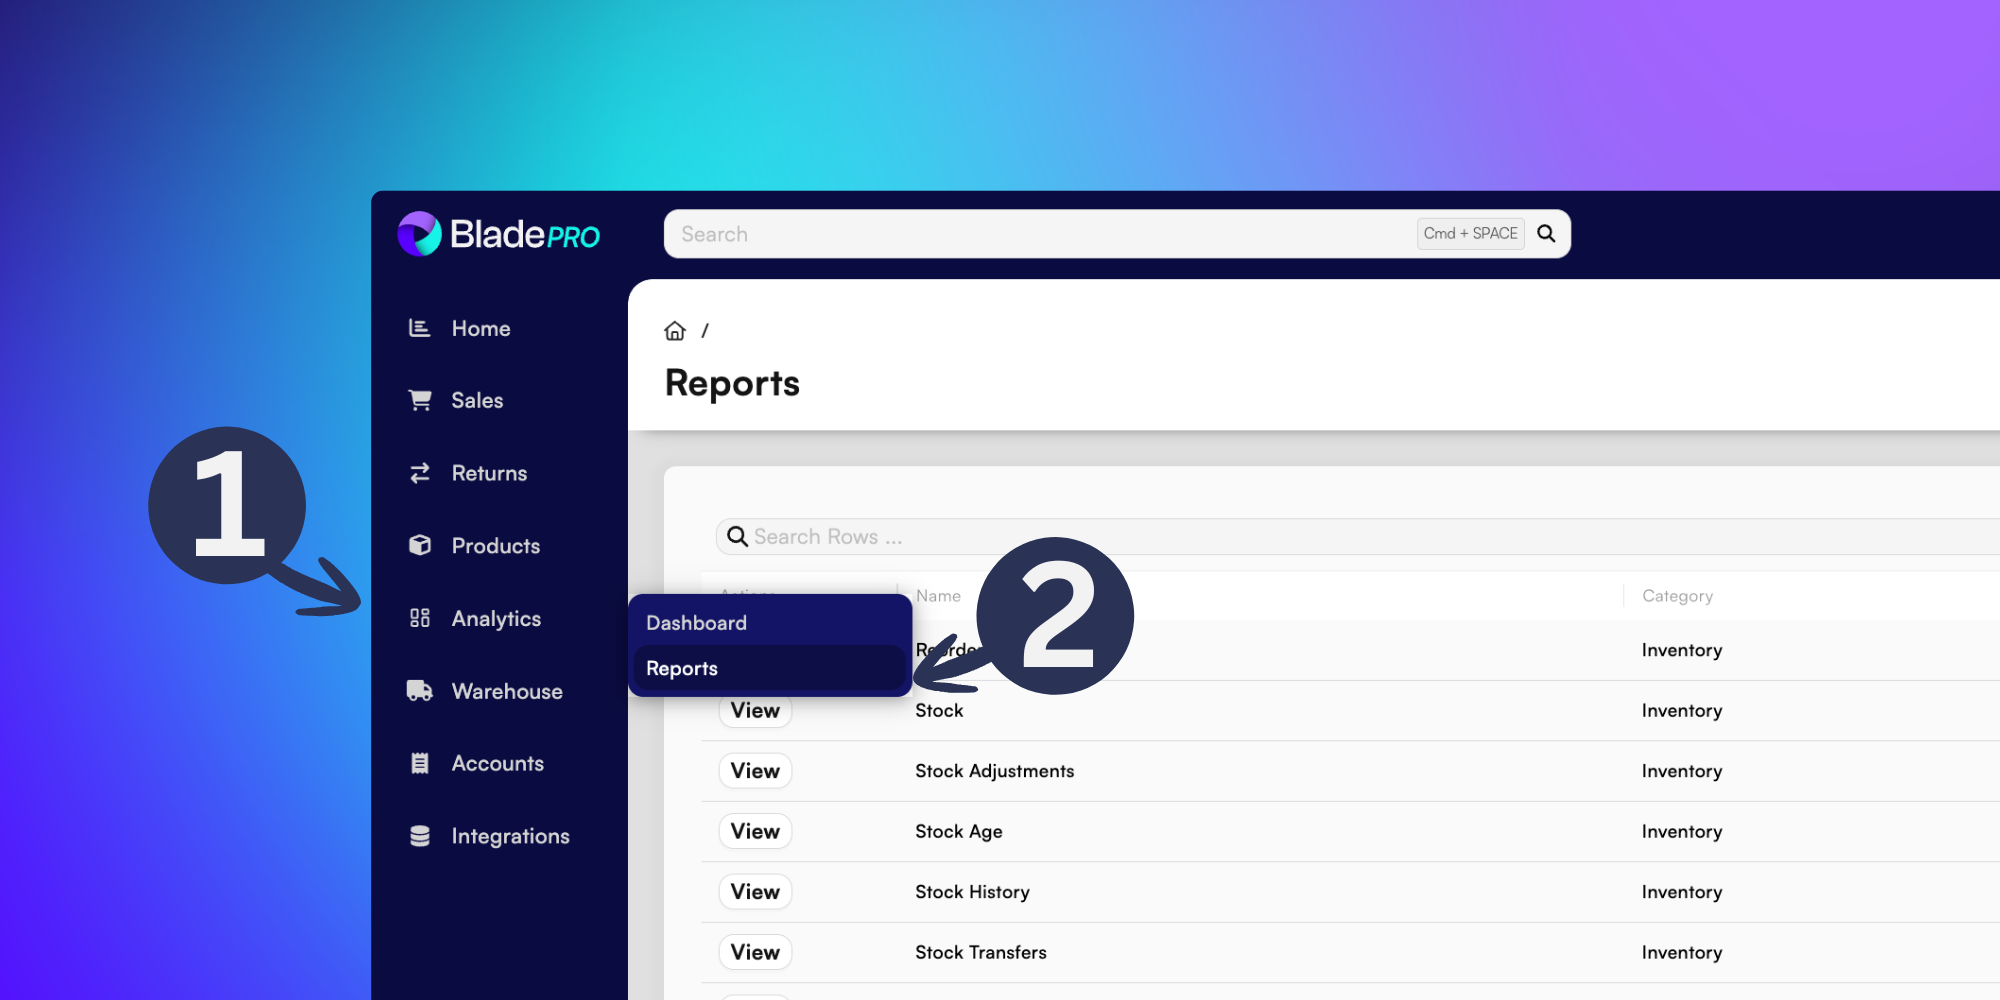
To find your reports, go to Analytics in the left menu (1), then click Reports from the popup (2).
From the Reports page, you can scroll or search through your list of reports.
Click View in the Actions column to open up the report details.
You can toggle the visibility of your columns using the Columns button in the right-side of the search bar, with options including:
Actions - Click View to open the report.
Name - Which records the report is monitoring.
Category - Which area of BladePRO is the report concerning.
Reports are categorised into the following:
> Shipments - View dispatched orders and revenue.> Inventory - Track stock levels, movement, and product performance.
> Purchasing - Analyse supplier spend and purchase order activity.
> Returns - Analyse returned items and reasons for return.
> Personal - View custom reports available only to your user profile.
Description - more information about what the report is showing you
Viewing Reports
Click View in the Actions column to open a report in more detail.
This will open the dataset in a new page - see the Stock report in the below example.
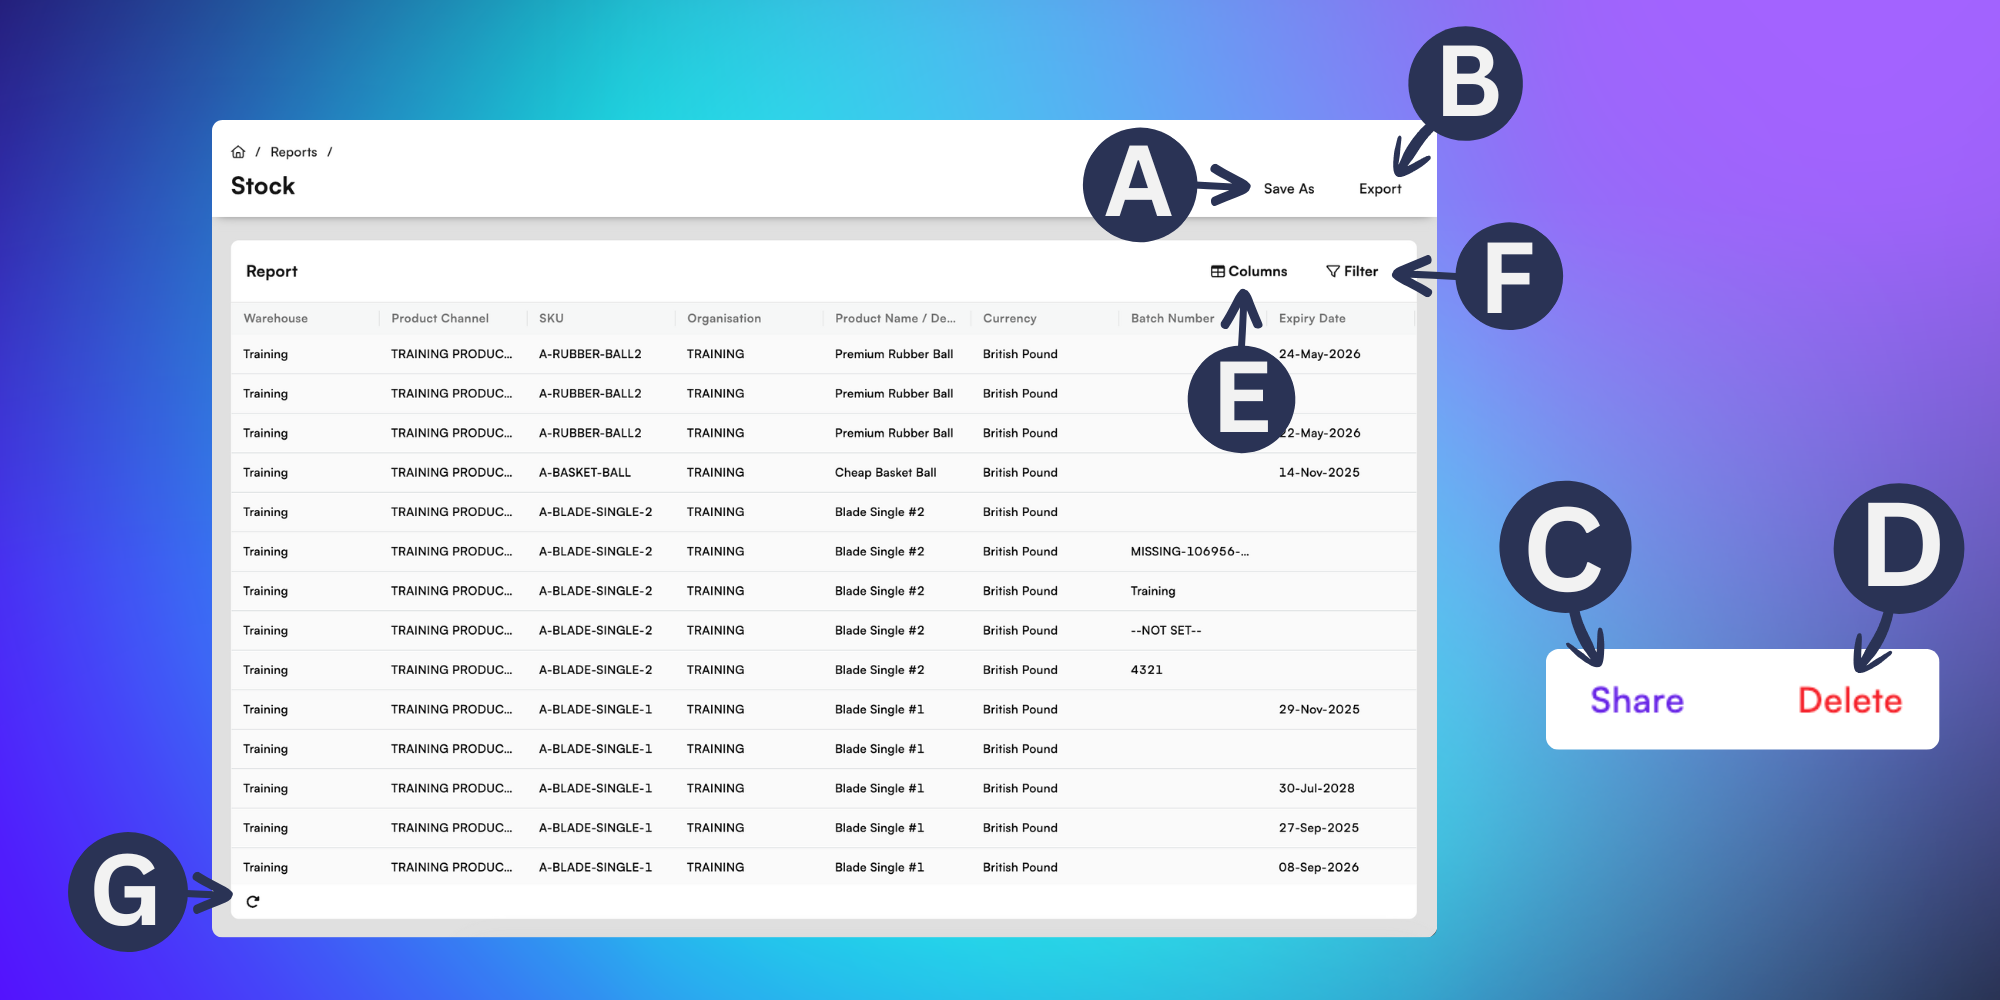
A) Save As - Save a copy as a new report in BladePRO.
Create a Title and Description of your new report and click Save. You will then be able to find your copy in the Reports page, categorised as Personal.
Unless shared (C), copies can only be seen by the user who created the report.
B) Export - Download a local copy of the report to your device in a .CSV file format.
C) Share - Make your report visible to colleagues using BladePRO.
D) Delete - Remove this report from BladePRO.
Share and Delete are only visible options on non-standard reports. You won’t have these options on default reports available in BladePRO - like the Stock report above.
E) Columns - Change the visibility of data fields in your report by toggling which you’d like to see from the checkbox list.
The more columns you enable, the more you may need to scroll horizontally to view them all. Exporting the data can provide greater flexibility.
F) Filter - Narrow down your dataset by chosen fields to focus on the most relevant information.
G) Refresh - Reload the report to see updated data.
Learn more about Reports in related guides, here:
Data mapping bulk templates - BladePRO